I got to read this comprehensive blog post by Charles Smutz today titled “Flushing out leaky taps 2” ; Like others working on products that do reconstruction we too have wrangled with this issue. Here is my take on this along with a small plug towards the end.
How good can an analyzer get in detecting network vs probe packet loss when deployed in a single observation point ?
- Estimate packet loss on network : It is well known that it is hard to pin point which TCP packets were lost in the network. In the forward path you can look at retransmissions and make a guess. But you cant say all retransmitted packets were originally lost due to a late ACK or a retransmission timeout. The reverse path is even more hairy due to the use of delayed ACKs. All this means is that you can only make a rough guess of network packet loss.
- Measure holes caused by the capture toolchain : Say a TCP session completed successfully with both sides ACKing the total payload size sent by the other side. Now irrespective of network packet loss your analyzer ought to have the complete payloads from both ends. If you reconstructed the TCP session and find holes, it is squarely the analyzers fault irrespective of the lossiness of the network. You can measure this accurately.
Analyzers can scramble the order
Frankly I have never found the “Lost Segment” flag in Wireshark to be very useful because it appears to flag all out of order segments which could be solely due to the components in capture stack shuffling the order around. This is all too common especially if you are hanging off a SPAN port, bonding two interfaces, or use an aggregating TAP sufficiently close to an endpoint.
Say you had a PCAP in which the remote side ACK-ed upto 1000 followed by the near side sending 1000 for the first time – this is clearly fishy. It is obviously inconceivable that the remote side would ACK 1000 which it never received up until that timestamp in your trace. Some questions pop to mind.
- Was the packet with sequence 1000 dropped by the network before it reached your analyzers observation point ?
- Did it make it to your observation point, but your capture stack could not reliably deliver it from the observation point to your application ?
In several captures, I have seen it is neither of these – if you just waited a little longer you would see the packet. The SPAN port, the adapter, the driver, the library, or even your code are simply not presenting the two uni-directional streams in perfect synchronized order.
Applications that reassemble need not be anything like a typical TCP endpoint. For starters it can afford to have an really enormous window and focus purely on “hole filling” completely ignoring the ACKs. If after the termination of a TCP flow, either by virtue of seeing a FIN/RST or a timeout, holes still remain it is purely the fault of the capture stack. Of course baking the hole detection inside your application is debatable because it entails more stateful tracking of each TCP connection..
If you are looking for another tool to add to your armory – read on for a small plug.
TCP Analysis with Unsniff
Unsniff has a TCP Congestion Analysis feature that can help here. This could be a useful addition to tshark. You can right click on any TCP Flow and select “TCP Congestion Analyzer” which would then run the all the normal analysis tasks like sequence number, window, inflight data, bandwidth, etc. It also tries to estimate the cwnd (the best it can given the constraints of a single observation point mentioned earlier). The two other things it can do are relevant to this blog post.
- A packet by packet analysis (like Wireshark) which points out out of order, dup acks, and retransmissions.
- A hole analysis which points out which segments definitely did not make it to the analyzer even though they went across the network..
How to use
1. First download and install Unsniff Network Analyzer from here. It is a free download and works on all Windows platforms.
2. Import your capture file via File > Import > TCPDUMP – You can use the capture files in this wireshark bug report
3. Once loaded you want to focus on these three tabs
- Packets – all link layer packets
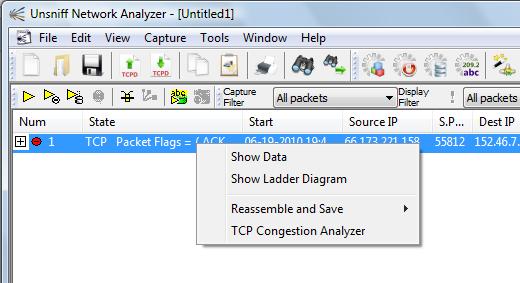
- Sessions – a list of TCP flows, right click any of them to access the TCP Analyzer
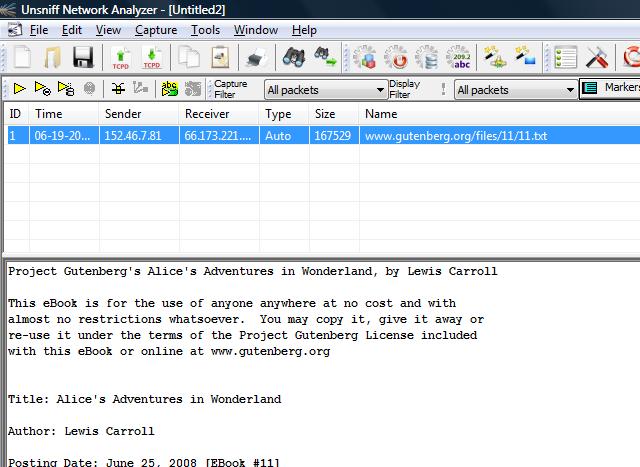
- User Objects – a list of user objects (files/images/etc) that are a result of reassembling content. If payload holes are present reassembly will fail, sometimes spectacularly when the content is streamed as in “gzip/chunked”
4. Switch the Sessions tab > right click on any flow > select TCP Congestion Analyzer
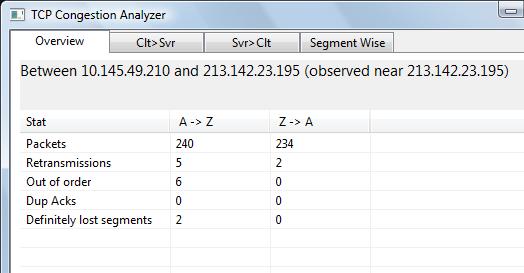
5. Within the congestion analyzer the Overview tab contains an item called Definitely Lost Segments for both directions. This contains a count of the number of holes found. The analyzer is responsible for this.
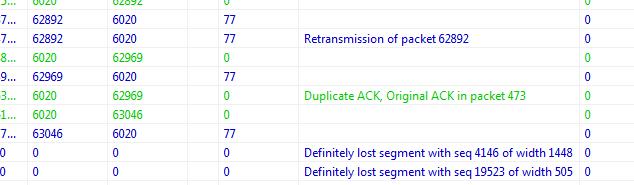
6. Switch over to the Segment Wise tab and scroll all the way to the bottom for a list of actual holes found.
7. If no holes were found, the User Objects tab would contain the reconstructed content. Here is Alice in Wonderland – an awesome read !