The latest release of Trisul Network Analytics [ release details ] has a really nifty self-monitoring feature. There is no need for outside tools like atop or nmon to check on Trisul’s performance any more.
To use the feature :
- Login as admin
- Select Tools > Perf Stats
The Perf stats dashboard is shown similar to the one below.
The modules shown in the Perf Stats dashboard are
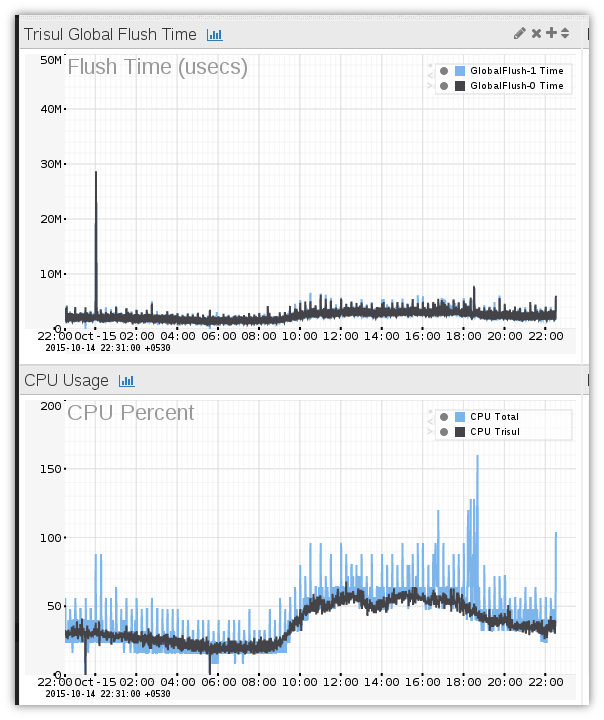
Global Flush Time
Trisul is a streaming network analytics engine. Since there is a continuous stream of high volume data, one key requirement is that aggregated results are flushed out within a small amount of time. Global Flush-0, 1 are the two default backend threads of Trisul flushing out in parallel. You can have upto 8 backend threads in that case all 8 will be shown on the graph.
Key thing to look for : See if there is spikiness in the chart, all data should ideally be less than 20 seconds.
CPU Usage
Shows Total and Trisul CPU Usage over time.
Lookout for : CPU being pegged. Ideally Trisul CPU usage must rise and fall with load. Unusual spikes in low traffic times have led us to find scans and DoS attacks as the Trisul TCP reassembly engine is stressed during these times.
Memory Usage
Total and Trisul Memory Usage
Lookout for : Memory climbing , this is very very rare and could indicate a memory leak. Trisul has a lot of hi-water and lo-water marks to restrict memory usage. If your server has a lot of memory you could consider increasing these numbers so Trisul can make more judicious use of RAM.
Disk Usage
Total and Trisul Usage. Shows the amount of disk used by the Trisul backend database.
Lookout for : If data climbs steadily and threatens to it the maximum, you may need to adjust the SlicePolicy to reduce the number of slices kept in the system. This way the DB size is kept smaller than the available disk space.
With this new feature, your Trisul monitors itself.
Have you tried Trisul Network Analytics yet ? It is a free download and can immediately start providing value to you !