Finally, we got some spare time to analyze a few traces available on the LBL-ICSI project website. We would like to extend a big thank you to these guys for making such a valuable resource publicly available.
The traces are available at http://bro-ids.org/enterprise-traces/hdr-traces05/
Tao Security has analyzed them at http://taosecurity.blogspot.com/2007/05/lbnlicsi-enterprise-tracing-project.html
This is a huge collection of 11GB of traces. Ideally, I would have liked to swallow in the whole set – but bandwidth and time issues stopped me. I picked a few traces –
- The first one (~6MB) lbl-internal.20041004-1303.port001.dump.anon
- A certain “port 16” on Dec 15 04 (~23MB) Â lbl-internal.20041215-0711.port016.dump.anon
- A “port 16” on Oct 04 04 (~11MB) Â lbl-internal.20041004-1438.port016.dump.anon
First thing to note is that these traces have their payloads stripped, only the first 54 bytes are captured. This precludes some of the advanced features like PDU, Stream, and User Objects, from working. Secondly, we are better off doing “traffic analysis” rather than “protocol analysis” on this huge glob of data.
Ok enough talking, lets start.
Lets get our tools ready. There are open source tools (pretty good ones too) such as capinfos , ntop , Wireshark can draw some IO graphs. You are welcome to try those, but we are going to put Unsniff R 1.5 Beta to the task here.
Before we begin, lets first convert Unsniff into a traffic monitor. We dont have full packet data anyway, so it makes sense cut the “protocol analysis” fat and in the process gain some speed and save memory. You can easily load several million packets into Unsniff in this mode.
- Go to Tools->Customize->Advanced
- Scroll down to the Advanced Capture item and set the “Do not store any packets” option to True.
Let look at the first trace output (Import the file and switch to the Traffic tab)
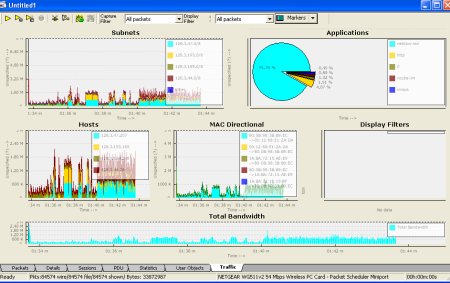
A real quick tour of the screen; the dashboard is completely configurable (via an XML file in the installation/Cfg directory) – the whole thing updates in “real time” but we dont care because we are just importing existing captures. In the above configuration, we see top hosts, subnets, protocols, mac-pairs, and total bandwidth. Lets see what the capture tell us :
Subnets
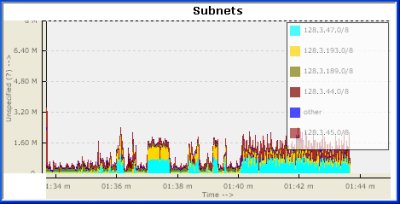
Ok, so its seems like 128.3.47.0, followed by 128.3.193.0 are the two most active subnets in this time period. Is this interesting information ? Probably, but since we dont know much about those subnets – lets move on.
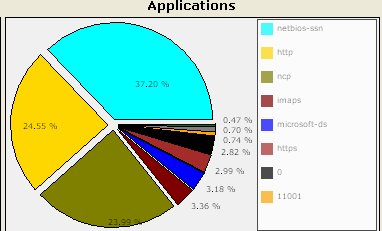
Protocols
Whats going on here ?
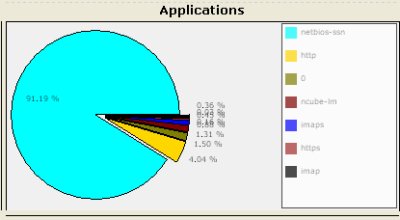
We see that the capture is 91.19% netbios-ssn. What is that ? We know from experience that it is nothing but Microsoft SMB. Unfortunately, Unsniff was not able to label it as “SMB” because the packets were truncated before the SMB header began. Ok, it seems we have a Microsoft shop here. ‘0’ (the second item) means non IP protocols (we ought to elaborate that).
Lets move to the other traces
Trace from port 16 – Dec 15 04Â (23MB) Â lbl-internal.20041215-0711.port016.dump.anon
This one contains about a 350,000 packetsÂ
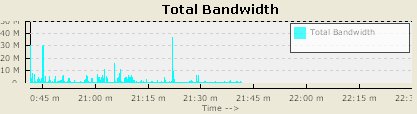
First the bandwidth strip. It seems like we have a lightly loaded, bursty link here.
The subnets and other charts dont seem to be too interesting, so lets go straight to the protocols.
We again have netbios-ssn (which we are sure is SMB), followed by HTTP and ncp (Novell). We can also see something on port 11001. Perhaps, that would be something to investigate further. From my experience, this is a fairly typical enterprise setup (except I havent seen much of Novell NCP )
Ok next,
Trace from port 16 – Oct 04 04 (11MB)Â Â lbl-internal.20041004-1438.port016.dump.anon
About 170K packetsÂ
So what kind of port is this ? Lets look at the bandwidth chart.
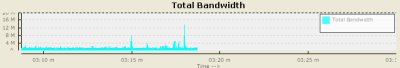
We have a sustained usage of about 3 Mbps, sometimes peaking upto 14Mbps. Allright, lets see what applications are running on that port.
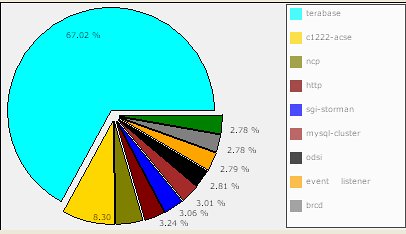
Whoa ! Didnt expect terabase and c1222-acse. So, we look turn to google and find that “ANSI C12.22 is used in the electric energy industry“ and terabase provides “high speed search engine and database solutions”
There are worms reported for port 4000 (the terabase port), but we dont know for sure without looking at the full data. Perhaps the network admin knows from experience whether these constitute legitimate traffic, but from a security standpoint we may have reached a dead end. Experts like Richard Bejtlich have been making a strong case for capturing the maximum amount of data that your resources can handle.
Interesting stuff indeed.
Note : These features are available only in the Unsniff Network Analyzer R1.5 Beta. If you would like to join the few who are participating – please send email to 
Â
[tags] network analysis, enterprise network analysis, unsniff [/tags]
1 thought on “Some Enterprise Traffic Analysis”
Comments are closed.