Deep statistical visibility into your network traffic is a fundamental requirement for any serious security conscious enterprise. While direct packet capture will remain the best primary source of deriving these statistical insights, Netflow and cousins (JFlow,IPFIX,sFlow) are the easiest to deploy and give you the biggest bang for the buck.
SiLK (acronym for System for Internet Level Knowledge) is a suite of open source Linux tools for collection, storage, and analysis of flow data. SiLK is created by the NetSA group at US-CERT
The two categories of SiLK tools are storage and analysis. The main tool for receiving compressing and storing flow records, called packing in SiLK terminology is rwflowpack The main tool for querying is called rwfilter These are very flexible command line tools that follow the typical Unix idioms of composability. You can pipe outputs of various commands and build your own query tools. In the hands of a skilled analyst these can be incredibly powerful.
However I found it quite hard to do some things in SiLK
- Analyze multiple things at once. It is a query-response model that goes back to the primary data source for each analysis item.
- Visualize time-series metrics. The query results are usually in terms of flows or aggregates or top-N lists. You can use rwcount to generate some basic time binned stats.
Trisul is a free real time streaming analytics platform which can supply some of the missing pieces to SiLK such as
- Time-series. From the flow data extracts hundreds of metrics and stores in a time-series. See some examples below
- Single pass analysis. Like all streaming platforms, Trisul needs to look at the flow data just once and various algorithms extract and store all data in a compact format. The raw flows are also packed, indexed, and stored for ad-hoc querying.
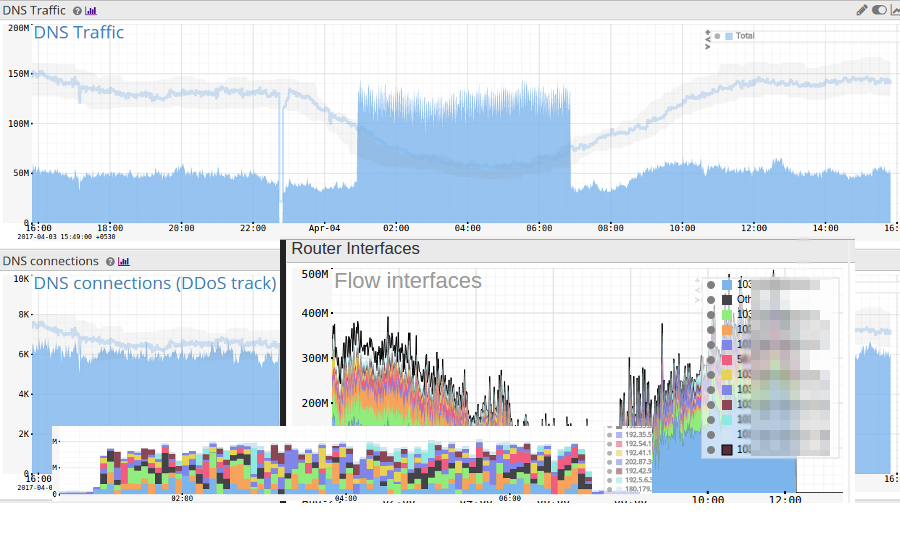
- Power User Interface. This is probably the most important addition. You have access to dozens of dashboards, Trisul’s second order metrics like “Number of Active Flows” , “Flow creation rate”, “Cardinality counters such as Unique Hosts per Port” etc.
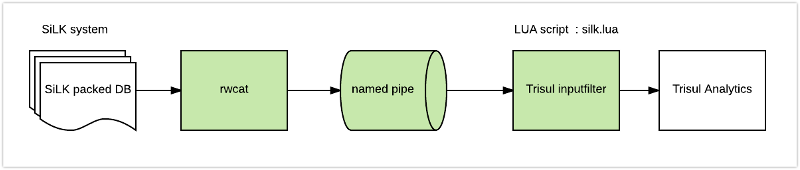
Without disturbing an existing live SiLK deployment and toolchain, we can use a SiLK tool rwcat to stream binary flow records to Trisul. Since Trisul has a fully customizable inputfilter LUA API, we attach it to the output from rwcat like so
Up and running
Here are quick steps to get it working.
- Install Trisul using apt-get or yum. It is free no signups required. The limitation of the free version is you can only store max 3 day window of data.
- Create a new analysis context to hold the data. To do that type trisulctl_probe create context silk11
- Download the following two LUA files from Github ( trisul-scripts ) into a directory say “/tmp”
- flowinput.lua : The helper library to process flow like data into Trisul
- silk.lua : Reads binary SiLK records from the named pipe
- Create a named pipe mkfifo /tmp/silkpipe This is the connector pipe.
- Run rwcat over your packed files and write to the pipe rwcat --ipv4-output --compression=none file1.17 -o /tmp/silkpipe Currently the script only handles IPv4 so we specify the –ipv4-output flag. Replace the file1.17 with your own list of SiLK dump files. At this time rwcat will appear to hang because there is no one at the other end of the pipe yet.
- Run trisul trisulctl_probe importlua /tmp/silk.lua /tmp/silkpipe context=silk111
- Wait for the process to complete you can tail the log to check progress. Type trisulctl_probe ; then when you are inside the CLI tail the log from the probe log log silk111@probe0 log=ns tail
So the whole command line looks like this
On 1 terminal
|
1 2 3 4 5 6 7 8 9 10 11 |
mkfifo /tmp/silkpipe trisulctl_probe create context silk11 trisulctl_probe importlua /tmp/silk.lua /tmp/silkpipe context=silk111 # (..wait..) then log silk111@probe0 log=ns tail |
On Terminal 2
|
1 |
rwcat --ipv4-output --compression=none file1.17 -o /tmp/silkpipe |
When the process completes. You can log on to the Web Interface and view the various dashboards, access the results, query flows and conduct further analysis.
Give it a shot and let us know how it works for you . We should be able to support IPv6 flows too via rwcat currently we dont have a use for it. Let us know in the comments section if you need that support.
How silk.lua works
Trisul has a full featured LUA API that allows both the packet pipeline and the analytics pipeline to be programmed. There are about 16 different script types which let you do everything from handle packets, reassembled flows, reconstructed HTTP files, process metrics streams, etc etc. Check out the Trisul LUA API Docs for an overview. One of the script types is the inputfilter. The inputfilter script allows you to drive the Trisul input from a LUA script. So we arrange to read from the namedpipe.
We use the incredibly cool LuaJIT FFI interface to process the binary records from rwcut, extract the required flow fields, and push it into Trisul. Once we extract the flow fields we load it into a LUA table and use the helper library flowinput.lua to push the metrics into Trisul.
Here is the relevant FFI snippet from silk.lua where we use the C Struct defined in rwrec.h and then read it on the LuaJIT side.
|
1 2 3 4 5 6 7 8 9 10 11 12 13 14 15 16 17 18 19 20 21 22 23 24 25 26 27 28 29 30 31 32 33 34 35 |
local ffi=require'ffi' -- -- SiLK format taken from file rwrec.h -- Sorry ! We only support IPv4 as of now -- ffi.cdef[[ struct rwGenericRec_V5_st { int64_t sTime; /* 0- 7 Flow start time in milliseconds * since UNIX epoch */ uint32_t elapsed; /* 8-11 Duration of flow in millisecs */ uint16_t sPort; /* 12-13 Source port */ uint16_t dPort; /* 14-15 Destination port */ uint8_t proto; /* 16 IP protocol */ uint8_t flow_type; /* 17 Class & Type info */ uint16_t sID; /* 18-19 Sensor ID */ uint32_t sIP; /* 40-43 (or 40-55 if IPv6) Source IP */ uint32_t dIP; /* 44-47 (or 56-71 if IPv6) Destination IP */ uint32_t nhIP; /* 48-51 (or 72-87 if IPv6) Routr NextHop IP*/ }; ]] -- use ffi.cast to typecast into LUA local cCast = ffi.cast("struct rwGenericRec_V5_st *", nextline) -- access fields !! local stime = tonumber(cCast.sTime)/1000 local ltime=stime+tonumber(cCast.elapsed)/1000 |
Conclusion
If you are running SiLK and would like to try out a new way of analyzing data you already have in your dump files – try this script and see how Trisul can help you get a very different perspective.
Download Trisul Network Analytics for free today . Installing it is as easy as apt-get or yum.
Happy SiLK ing